The Curious Case of the Never-Releasing Heap: A Java Tale ☕
How We Solved Java Memory Retention with JEP 346

LeMans—a Java service named after the iconic LeMans circuit race track—operates within our Kubernetes cluster.
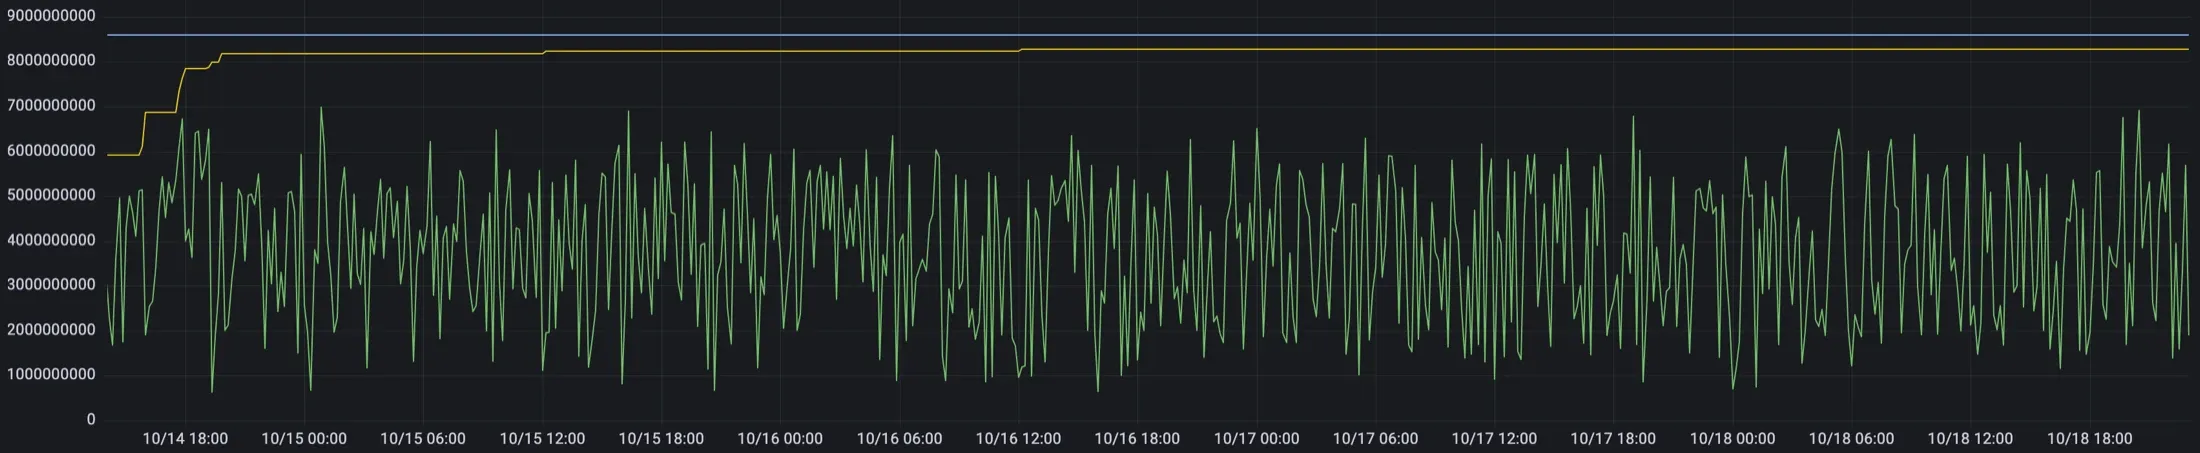
The service demonstrated stable performance and healthy resource utilization during normal operation. However, during periods of low activity, we observed in our Prometheus graphs that memory usage remained elevated even as demand decreased. This indicated that the system was not releasing resources as efficiently as expected.
This issue was first flagged by multiple KubeMemoryUtilizationHigh alerts, prompting a deeper investigation. Initially, a memory leak was suspected, but further analysis revealed that the problem was related to the JVM’s G1 Garbage Collector’s behavior.
The Setup
We run several Java microservices in our Kubernetes cluster, and LeMans is one of the busiest. It reads events from Kafka and processes them continuously.
Pod configuration (single pod):
resources:
  limits:
    cpu: 4000m
    memory: 11000Mi
  requests:
    cpu: 3000m
    memory: 9000Mi
At peak, each pod processes around 37k requests per minute while using roughly 40 percent CPU and about 1 GB of memory. Across regions, the service handles over 100k RPM consistently.
However, the memory graph told a consistent story. Even when traffic dropped at night, the committed memory remained stable. Only a pod restart brought it down. Multiplied across multiple pods, this led to inefficient memory usage and higher operating costs 💸.
(Below is the Production Memory Graph)
Understanding the G1 Garbage Collector
In Java 11, the G1 Garbage Collector (GC) does not promptly release committed heap memory back to the operating system. It only does so during either:
- a full GC, or
- a concurrent GC cycle triggered by heap occupancy thresholds.
Since G1 avoids full GCs to maintain low pause times. While this enhances performance consistency 🚀, it also increases resource over-commitment in containerized environments where memory equals cost.
We initially suspected an internal memory leak, but a closer look at the JVM metrics told a different story. The heap’s used memory reached around 6 GiB during peak load and dropped to about 2 GiB when traffic declined, confirming that garbage collection was happening correctly. This showed that the issue wasn’t in our code but in how the JVM managed committed heap space was not returned to the OS.
The Experiment
The test setup compared two images:
Java Image              |  Java Version  |  Key Difference
------------------------+----------------+------------------------------
amazoncorretto:11.0.28  |  Java 11       |  Baseline (G1 default)
amazoncorretto:21       |  Java 21       |  Includes JEP 346 memory
                        |                |   release improvement
Testing LeMans on Java 11 and Java 21 (fixes available from Java 12) revealed:
-
Java 11 retained high committed heap memory regardless of load drops.
(Staging Memory Graph)

-
Java 21, with JEP 346, released committed heap memory back to the OS during idle phases.
(Staging Memory Graph)

JEP 346: The Key Change
JEP 346 introduced the ability for the JVM to return unused committed memory back to the operating system when the heap is underutilized. This makes memory usage more dynamic and cost-efficient 💡 in microservice and container-based environments.
However, memory allocation and release are expensive at the system level. Services that frequently scale up and down or experience sharp load changes should analyze GC overhead carefully before tuning this behavior.
Repository
You can explore the sample Java application, Dockerfiles, and Prometheus/Grafana setup in the repository below:
Lessons Learned
- High memory usage graphs don’t always indicate leaks.
- Garbage collector choice can affect both performance and cloud costs.
- Keep track of JVM version improvements like JEP 346.
- Visualizing GC metrics helps uncover hidden behaviors.
- Tune GCs according to your application traffic pattern and workload.
Quick Summary
Topic       |  Insight
------------+------------------------------------------------------
Problem     |  Heap memory not reducing during idle periods
Root Cause  |  G1 GC in Java 11 retains committed heap memory
Solution    |  Java 17 (JEP 346) allows dynamic heap release
Takeaway    |  GC tuning balances efficiency, performance, and cost
Final Thoughts
This investigation reminded us that understanding the JVM is just as critical as optimizing your code. Sometimes, the fix isn’t about patching logic but about learning how your runtime thinks and behaves 📘. A simple version upgrade and configuration clarity solved what looked like a deep memory issue.
Stay tuned for more insights on Java internals, Node.js, DevOps, and AWS. Follow along and keep learning with me—we’re just getting started. 🚀